42% of SMEs lose sales to stockouts
See low-stock warnings by line, store, and channel, so you can replenish the right product before the shelf goes empty.
Running a shop shouldn’t mean guessing what sells. Emery Apex Group shows your bestsellers, slow-movers, and profit leaks live, so you can act before waste eats the margin.
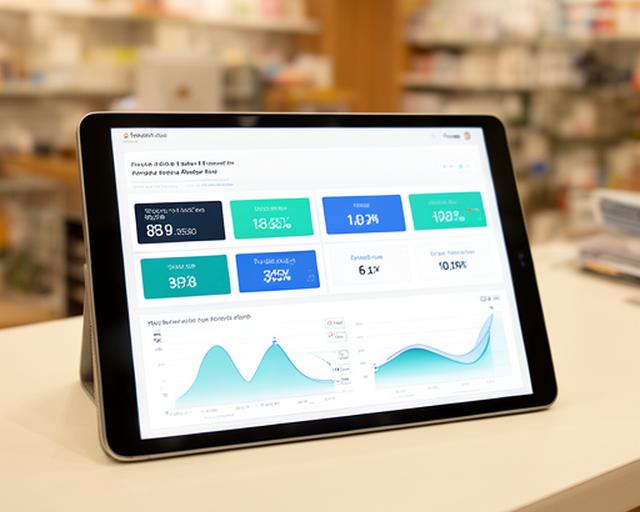
Why let the till tell half the story? Our UK SME retail analytics surfaces the hidden drag on margin before it becomes a markdown.
See low-stock warnings by line, store, and channel, so you can replenish the right product before the shelf goes empty.
Our dashboard highlights slow movers and ageing stock. What would you do with an extra £20k working capital back in play?
We pull the numbers together automatically, so your team can stop copying and pasting and start trading with confidence.
Need a clearer read on the day? This carousel-style showcase moves through the views that matter most to independent retailers.
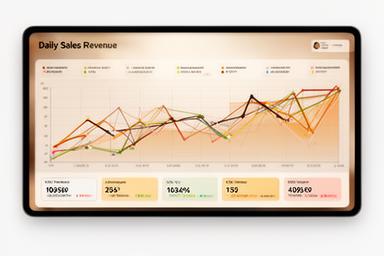
Spot spikes as they happen. A weather surge? A lunch rush? The chart shows it, notifies you, and keeps your decision-making sharp.
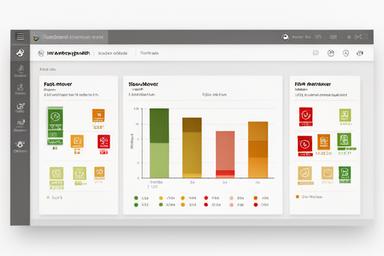
See what needs ordering, what should be discounted, and where the margin is leaking. Simple. Clear. Useful.
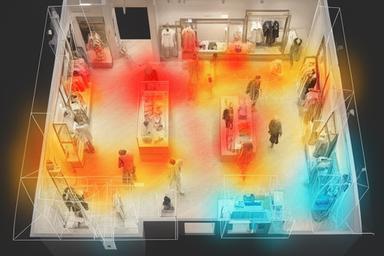
Understand where customers dwell, which displays pull attention, and how traffic shifts through the day. Who doesn’t want that clarity?
Physical store, webshop, Deliveroo, Amazon, Shopify, Square, Epos Now, and more. Our multi-channel inventory AI connects the dots, so your team can stop arguing about which spreadsheet is right.
Our AI doesn’t replace your judgement. It backs it up with cleaner numbers, tighter timing, and fewer costly surprises.
They had eight locations, inconsistent reporting, and too much expired stock. Sound familiar?
“We were ordering on habit. Emery Apex Group showed us the pattern behind every quiet Tuesday and busy Friday, and suddenly the numbers made sense.”
Amelia Hart, Operations Director at Brewed Awakening
Within months, the team reduced waste by 28% and saved £47,000 annually across their sites. They also rebalanced staff rotas around footfall rather than instinct. Better margins. Less stress. That’s the point.
Disconnected tills and Excel files hid stock trends until losses had already landed.
A live retail sales dashboard joined product, venue, and channel data with predictive ordering prompts.
Lower waste, better replenishment, and a manager view that made buying conversations faster.
Need to improve staffing or rework the layout? Our retail footfall heat maps make traffic patterns impossible to ignore.

We layer traffic patterns with weather and local event data, so your team can see why the lunchtime spike happened and what to do next. A busy Saturday is good. Knowing why it was busy is better.
See the routes shoppers actually take.
Compare ends, counters, and promo tables.
Weather and events explain the spikes.
No credit card required. Want a quick call instead? Use the number below and we’ll talk through your stores, channels, and reporting headaches.